Culture, Climate Science & Education

SECTION FIVE
Sensors and Image Datasets
Click the Bubbles Above or the Double Arrows () to Explore this Section
A. Introduction
Click image to expand

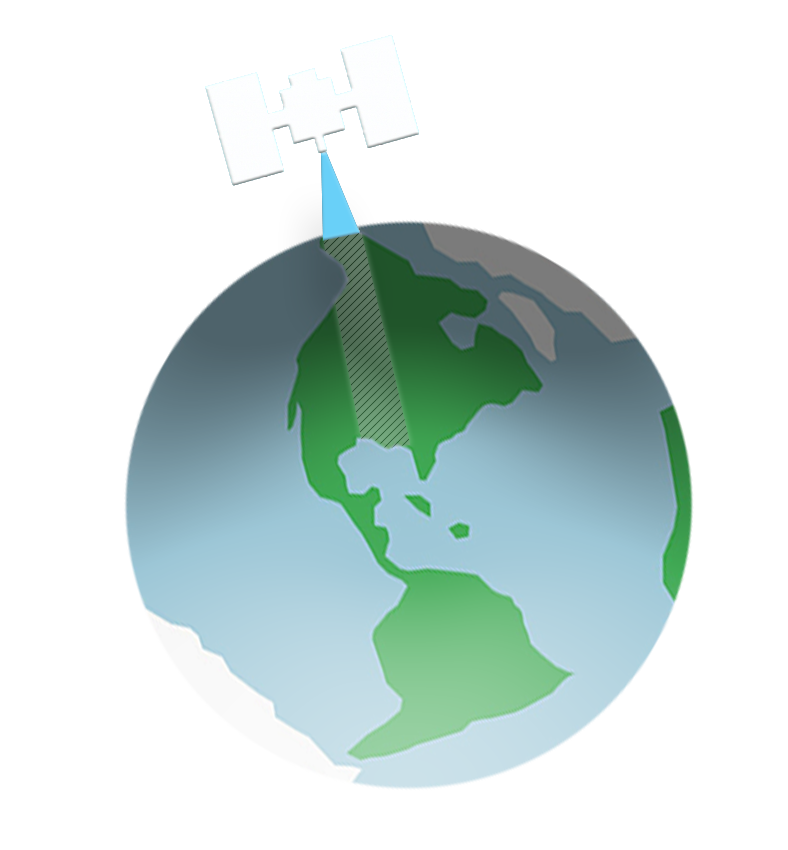
VIDEO: NASA's Vantage Point to View Earth
We will now build from the Characteristics of Imagery section, advancing your ability to choose the right remote sensing tools for different questions & applications—especially regarding climate science.
Specifically, this section will overview types of sensors and highlight commonly used datasets provided by remote sensing.
Click the Bubbles Above or the Double Arrows () to Explore this Principle
B. Active and Passive Sensors
Click image to expand

Credit: Arkarjun 2013 Nov 20 [CC BY-SA 3.0] Accessed 2019 Jan 1
Remote_Sensing_Illustration.jpg
Active sensors create their own electromagnetic energy to “light up” their field of view, and then detect the reflected energy. Think of using a flashlight in the dark woods. You control a beam of light, which reflects off your surroundings and is detected by your eyes. Active systems can operate day or night but require a large amount of energy.
Many active sensors use ranging—timing the return signal (termed backscatter) to create a 3D terrain map, called a digital elevation model (DEM).
Passive sensors detect electromagnetic energy that originates from another source—usually the sun. For example, a camera without a flash is a passive sensor—when using a flash a camera becomes an active sensor.
Click the Bubbles Above or the Double Arrows () to Explore this Principle
C. Active Radar (Radio Detection and Ranging)
Radar was invented during the Second World War, to detect the distance & direction of enemy aircraft and ships. Like most military remote sensing technology, radar has been adapted to civilian and scientific use. Radar mounted on an aircraft or satellite can be directed downward—timing the backscattered signal from the ground creates a terrain map. For example, NASA’s SRTM (Shuttle Radar Topography Mission) in 2000 gave us a global terrain map, freely available to the public at 30 meter resolution.
These “digital elevation models” (DEMs) are the most widely used product from active sensors—used for terrain display/analysis and also for orthorectification of imagery. Shorter wavelengths allow better spatial resolution but less vegetation & weather penetration.
Revisiting the Electromagnetic Spectrum
Click image to expand

Credit: UC Regents 2002. Accessed 2019 Jan 1. http://ds9.ssl.berkeley.edu/LWS_GEMS/2/espec.htm
Radar uses the short-wavelength radio waves, called microwaves. The terminology can be confusing. Microwaves are part of the “radio” region of the EMS, as the acronym “radar” suggests—common usage of the terms sometimes suggests radio and microwaves are altogether different. Unlike medium- & long-wave radio, microwaves can be pointed in a specific direction as a narrow beam. Longer-wave radio can travel around hills and obstacles, while microwave transmission is limited to line-of-site.
Radar Applications
Click image to expand

Synthetic Aperature Radar (SAR) image of Death Valley, CA, from 1994 Space Shuttle flights. This penetrating radar also revealed ancient river channels in Sahara Desert, indicating past climate change, was well as lost archeological sites. See url for image & sensor details:
https://photojournal.jpl.nasa.gov/catalog/PIA01349. Credit: NASA JPL 1999 Sept 27
Click image to expand

Microwave bands shown on right. Random alphabetical names were used by the British to maintain secrecy, while radar technology was developed during WWII. Credit: Kaab et al. 2014
Although radar imagery looks similar to a black and white photograph, the information it contains is quite different. Microwave backscatter depicts surface roughness and is influenced by the surface’s orientation, conductance (and thus moisture content), and the wavelength band used (Aronoff & Petrie 2005).
The earth reflects/emits much less intensely in microwaves, and active sensors illuminate what would otherwise be a dim signal (or coarse spatial resolution, needed to capture more energy per area). Passive microwave sensors are used, however—useful for soil moisture and freeze-thaw cycles for climate studies.
Satellite radar provides repeat coverage, allowing for change detection over time. Beyond range & elevation measurements, signal processing of radar polarization and phase (termed radar interferometry) provide a wealth of information. Visit the hyperlinks below for videos illustrating sensor applications.
Elevation change
Sea level rise
Land subsidence (from drought & aquifer extraction)
Ocean floor topography
Watch first two minutes of this video. Ninety percent of the ocean floor was unmapped until recently.
Movement (velocity & direction)
Surface roughness
Soil Moisture
Active radar vs passive radiometer
Timing of freeze & thaw cycles
Climate indicators (e.g. average surface temperature & precipitation)
Microwaves In Your Life
On a side note, numerous everyday activities depend on microwave energy. All sorts of communications use microwave frequencies—cell phones, Wi-Fi Internet access, and satellite TV. Most long distance phone calls are relayed via microwave to communication satellites, and data transmission to/from satellites (e.g. transmitting imagery) mostly occurs in microwave bands. Microwave ovens use 2.45 GHz frequency (12 cm wavelength) to excite water molecules and heat food.
Click the Bubbles Above or the Double Arrows () to Explore this Principle
D. Lidar (Light Detection and Ranging)
Click image to expand

VIDEO: Cool Ways of Studying the Cryosphere
Click image to expand

Credits: NASA Earth Observatory/Joshua Stevens
Lidar systems (active) create laser pulses of visible or infrared light to map both ground/water elevation and vegetation canopy height/density. Formerly restricted to aircraft, lidar provided better resolution compared to radar but piecemeal coverage. Recent, improved satellite-based lidar will offer global, repeated coverage as of 2019.
Lidar Applications
Lidar is a quickly growing technology; the application and availability of lidar datasets related to climate science (e.g. terrain; biomass) and ecosystem structure (i.e. vegetation height & density) is growing rapidly. Lidar units can be mounted on drones for very high resolution DEMs—all lidar datasets require large file storage.
Active forest management and forest clearing/conversion are often lumped together in public perception. Yet forest management and forestland clearing (e.g. conversion to agriculture, common today in tropical forests) have very different impacts in regards to carbon cycling and climate change. Sustainable forest management ensures forest regrowth after harvest. Watch the GEDI video below and answer this question: How would converting forest to agriculture or developed areas differ, in regards to atmospheric carbon?
Click the Bubbles Above or the Double Arrows () to Explore this Principle
E. Multispectral Scanners (Passive)
Multispectral scanners record several visible & infrared wavelengths. Most of the image analysis activities at the end of this course use multispectral data—the imagery is well suited for climate and natural resources studies, image analysis is more straight forward compared to radar & Lidar image processing, and plenty of multispectral imagery is free for public download.

Website: Click the image above to visit this MODIS website that shows five true color images of the collapse of the Antarctic Larsen B ice shelf of January, February, and March 2002, recorded by NASA's MODIS satellite sensor (coarse resolution, multispectral).
Click the Bubbles Above or the Double Arrows () to Explore this Principle
F. Coarse Resolution, Multispectral Sensors (Passive)
Image footprint—compare swath width and pixel size
Visit this website and then:
Extra Learning
(Click to Learn More)
A spatial resolution of over ~250 meters is considered low-resolution for earth observation satellites. Geostationary satellites (e.g. weather forecast) use high orbits (~36,000 km) in sync with the rotation of the earth and always view the same wide area with continuous coverage with ~1 km pixel resolution.
Course resolution sensors typically have wide imaging swaths and good temporal resolution—frequent repeat images of the same area—for studying continental & regional patterns. The two identical MODIS sensors on NASA’s Terra and Aqua satellites have low spatial resolution (250 – 1,000 m) and 2,330 km imaging swaths, providing 1-2 day repeat coverage in a fairly large number of 36 narrow spectral bands (on next page, compare MODIS spectral resolution with other sensors). MODIS is also used for rapid wildland fire detection & response.
Click the Bubbles Above or the Double Arrows () to Explore this Principle
G. Medium Resolution, Multispectral Sensors (Passive)
Click image to expand

Credit: NASA GSFC. L. Rocchio and J. Barsi
In 1972, NASA’s Landsat 1 marked the first in a legacy of medium resolution satellites, revolutionizing our ability to perform digital image analysis for landscape-scale studies.
Several medium resolution (~5 to 250 meters) earth observing satellites have been launched since. We will focus on free, publicly available datasets, of note are:
Sensor Highlight: Landsat
(1972-Present)
Landsat (1972-present)
Climate science requires decade-scale weather and earth observations—Landsat imagery is truly unique, approaching 50 years of continuous earth observation. Former NASA Administrator Dr. James Fletcher in 1975 predicted that if one space age development would save the world, it would be Landsat and its successor satellites. (NASA, https://landsat.gsfc.nasa.gov/about/)
In 2008, the USGS announced a revolutionary policy: the US would be the first nation to distribute satellite imagery free of charge. Prior, each Landsat scene—or any other satellite image—cost several hundred US dollars, limiting satellite image usage in research budgets and in education.
Landsat 8 (formerly called LDCM) presented by Jim Irons, Director of the Earth Sciences Division, NASA Goddard Space Flight Center. Credit: NASA Goddard Space Flight Center 2018 Dec 17
Landsat Timeline
Click image to expand

Credit: NASA Goddard Space Flight Center. 2018 Dec 17
Funding for Landsat
Landsat offers knowledge of the planet we rely on for existence and well being, however, our ability to manage & protect earth resources in an informed way should not be taken for granted. Several times in recent decades, funding to continue Landsat earth observation (and other climate-related study) has been in question—climate science is of course a politically sensitive topic.
While political opinions will always—and should be—open to debate, societies should be very wary of censoring, directly or not, scientific fact. Scientific data and fact are very different things from opinions and should be treated, and reacted to, as such.
UN Sustainable Development Solutions Network (SDSN) says:
“The United States Government has funded Landsat since its inception. But the relationship between NASA and the institution that legislates that funding (the U.S. Congress) has been turbulent, with ongoing disagreement over the amount of resources required for the Landsat program and available through the U.S. federal budget. The Landsat 9 mission is no exception.” Jessica Espey (SDSN TReNDS Director). 2018. “Landsat's earth observation data support disease prediction, solutions to pollution, and more”
The United States is considering ending the open data policy for Landsat imagery; likely this would indirectly but significantly limit research & educational use. A response comment from Nature, a multidisciplinary science journal: “A USGS survey of Landsat users released in 2013 found that the free distribution of Landsat imagery generates more than US$2 billion of economic benefit annually — dwarfing the programme’s current annual budget of roughly $80 million.” Popkin G. 2018 April 24. Nature. v.556, p.417-418.
Sensor Highlight: Sentinel Satellites and Copernicus Program
Sensor Highlight: Sentinel Satellites & Copernicus Program
The European Space Agency (ESA) launched a new generation of earth observing satellites, called Sentinels, in 2014. The program is called Copernicus—pairs of 6 different satellites monitor different aspects of earths land, water, and atmosphere. Sentinel-2 is a multispectral sensor similar to Landsat 8, but with higher spatial resolution.
Copernicus imagery, like Landsat, is publicly available and free of charge.
Click here for the list of Copernicus Sentinels’ sensors, with additional specifications


